NISR-Data revolution and Big Data
Section A: Multiple choice questions/36marks
1.Which of the following is an appropriate evaluation metric for regression?
2 points
- Mean Square Error
- Recall
- Precision
- Sensitivity
2.X and Y are independent random variables. X has mean 100 and standard deviation 12. Y has mean 30 and standard deviation 9. What are the mean and standard deviation of (X–Y)?
2 points
- Mean 65, standard deviation 10.5
- Mean 70, standard deviation 3
- Mean 70, standard deviation 21
- Mean 70, standard deviation 15
3.A random sample of 500 is taken from a much larger population and the 95% confidence interval for the population mean is calculated as 576 ± 23. A further and independent random sample of 500 is taken from the same population and a new 95% confidence interval for the population mean calculated on the combined sample of size 1,000. Which of the following is the most plausible new confidence interval?
2 points
- 575 ± 11
- 576 ± 23
- 577 ± 16
- 576 ± 56
4.Which of these regression methods is non-linear?
2 points
- Support Vector Machine
- Ridge
- Lasso
- K Nearest Neighbor
5.A colleague says they used LASSO regularization as part of their regression analysis. What challenge is it likely they are trying to address?
2 points
- High dimensionality of the dataset
- Overfitting
- Non-linear relationships between features
- Missing values
6.You have been tasked with clustering the features of a large corpus of text files. Each text file needs to be organized by subject area. Which unsupervised learning algorithm will provide the best vector representation of the data for clustering?
2 points
- Doc2Vec
- Graph2Vec
- Bag of Words
- Word2Vec
7.A country is divided into 301 sectors of various sizes. The 12th largest contains a population of 35,000 people and the 5th smallest contains 6,000 people. Assuming the population difference from one sector to the next largest is fairly uniform, which of the following is closest to the median population of the 301 sectors?
2 points
- 20900
- 30700
- 19000
- 15350
8.Which of the following combines models based on subsets of features and observations to produce output?
2 points
- Lasso Regression
- Convolutional Neural Network
- None of the options
- Random Forest
9.Which of the following techniques can be used to convert words to their root forms?
2 points
- Cosine Similarity
- Stemming
- Soundex
- N-grams
10.Your team is beginning a new Geographic Information System (GIS) project using satellite imagery to identify residential areas in Rwanda. Given you have a large amount of training data that is already classified, which of the following machine learning techniques would be most appropriate for this task?
2 points
- None of the options
- Convolutional Neural Networks
- K-Nearest Neighbours
- Linear Regression
11.As part of a GIS project to determine new sampling frames in Rwanda, you are given a list of addresses and asked to geocode them to provide an estimate of the number of houses in a given area. Which of these would be the most significant problem in using an external geocoding API, such as those provided by Google, for this task?
2 points
- Geocoding will not be possible for most rural areas
- The results of the geocoding may not be accurate for high-density urban areas
- There may be a mismatch between the mapping projection used by Rwanda and the external API provider that cannot be fixed
- None of the options
12.You are visualizing the results from a new survey where district level data is contained within provinces, and sector level data is contained within districts. Your manager is interested in the hierarchical relationships between provinces, districts and sectors. Which of these visualizations is likely to be LEAST useful for your manager? Interpolation to estimate rainfall at other points. What principle are you using?
2 points
- Area chart
- Tree map
- Sunburst diagram
- Circular tree map
13.Data are collected on a sample of girls aged from 5 to 11 years. Their age x, in years and their height y in cms are recorded and found to be consistent with a linear relationship. The regression line of height on age is y = 80 + 4x. Which one of the following is a correct conclusion?
2 points
- Over the next three years we would expect a 6 year old girl in the sample to grow by about 12cms
- The maximum height of the girls in the sample is 100cms
- The average height of the girls in the sample at age 15 is expected to be 120cms
- The regression line of age on height can be found by rearranging the equation to give x = 0.25y – 20
14.A survey of agricultural productivity is to be taken by sampling the population of local areas using a registry of crop types. In deciding how to select the sample which of the following factors is likely to be the MOST important?
2 points
- The amount of time and resources available for sampling the population
- How different the demographic characteristics are of the population in the area
- The size of the population in the area
- The seasonality of the crop yield
15.A solid cylindrical drinks can is approximately 20 centimeters high and 8 centimeters diameter. Which of the following is closest to its volume in centimeters cubed? (The formula for the volume of a cylinder is π x r^2 x h, where π = 3.14 approximately, r is the radius and h is the height).
2 points
- 1005
- 4020
- 500
- 1050
- Suppose the rate of interest on a savings account is 2.5% per annum, added to the account at the end of each year. How many years will it be before a sum of money deposited in the account has increased by more than quarter?
2 points
- 11
- 12
- 9
- 10
17.In which of the following circumstances would you expect clustering to be most useful, in helping to select a suitable sample?
2 points
- When the variation of the population is very different from that of the clusters
- When the variation within clusters is likely to be similar as that of the population and the resources available to the survey team are limited
- When the population of interest is condensed in one small area
- When a survey is highly resourced
18.For a given dataset, it seems that for some technical reason, the data for every fifth observation for a given variable is missing. This indicates that we have a missingness of type:
2 points
- Not at Random
- Completely at Random
- At Random
- Missingness depends on an unobserved factor
Section B: Open questions/14marks
19.The main source of information for population movements (human mobility) have sample surveys of individuals. What other data sources might now be available to replace or complement survey data to provide insights into population movements on a daily basis? How could these sources be exploited? Please consider the types of application and analysis to be carried out, how this supplements survey data, and how the results would add to existing understanding of time use in the population. You may make plausible assumptions about the type of data available. You can assume that the data is available in consistent and well-documented format.
7 points
- During the COVID-19 pandemic it became important to understand the impact of Coronavirus on the economy. What other data sources might now be available to replace or supplement traditional economic statistics to provide more timely, more frequent or more granular insights to understand changes in Rwanda’s economy? For each data source, explain the analytical techniques/tools which could be used? What are the potential analytical outcomes from this analysis? You can assume that the data is available in consistent and well-documented format.
7 points
Umubirizi uzwiho kuvura inzoka zo mu nda burya uvura n’izindi ndwara zitandukanye
Umubirizi uzwiho kuvura inzoka zo mu nda burya uvura n’izindi ndwara zitandukanye harimo: Kuribwa mu gifu, Kanseri ya porositate, Umusonga , Kubura ibitotsi, Kongera uburumbuke, Umwijima ,Kanseri y’ibere, Kongerera amashereka, Impyiko , Diyabete nizindi.
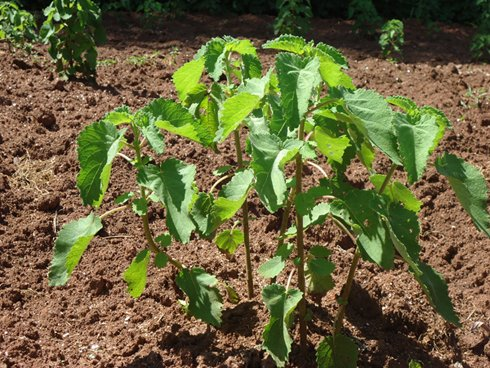
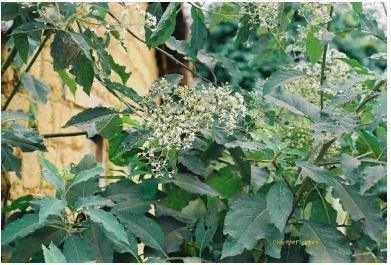
Umuravumba (Tetradenia riparia) ni umuti utangaje
Umuravumba ni ikimera gitangaje Imana yatwihereye, turusheho gusobanukirwa ni ki kimera nakamaro gifite mumibereho yacu; aho uvura indwara zitandukanye na zimwe utari uzi.
MARKING GUIDES OF PAST PAPER NATIONAL EXAMINATION P-LEVEL 2019:
AMAKURU MASHYA
- Test 1 of Mathematics for students of p6 April 15, 2024
- NATIONAL EXAMINATION OF MATHEMATICS P6 PREPARATION TEST 2 December 30, 2023
- MARKING GUIDES OF NATIONAL EXAMINATIONS PAST PAPERS. December 20, 2023
- MATHEMATICS NATIONAL EXAMINATION PREPARATION TEST 1 December 20, 2023
- AMATEGEKO Y’UMUHANDA, NAWE WATUNGA PROVISOIRE December 19, 2023
- National Examinations Past Papers (2002 – 2023) December 16, 2023
- NATIONAL EXAMINATION RESULTS for ADVANCED LEVELS 2022-2023 December 4, 2023
- SCIENCE BOOKS FOR RWANDAN SCHOOLS November 11, 2023
- BOOKS OF REB POR P-LEVEL, O-LEVEL AND A-LEVEL November 11, 2023
- BOOKS OF REB FOR S6 ADVANCED LEVEL (S6, A-LEVEL) November 8, 2023
- BOOKS OF REB FOR S5 ADVANCED LEVEL (S5-LEVEL) November 8, 2023
- BOOKS OF REB FOR S4 ADVANCED LEVEL (S4-LEVEL) November 8, 2023
- BOOKS OF REB FOR S1 ORDINARY LEVEL November 8, 2023
- BOOKS OF REB FOR S2 ORDINARY LEVEL November 8, 2023
- BOOKS OF REB FOR S3 ORDINARY LEVEL November 8, 2023